Intel Trace Analyzer and Collector
Introduction
Intel Trace Analyzer and Collector (ITAC) is a tool to collect and graphically analyze behavior of MPI applications. It helps you to analyze communication patterns of your application, identify hotspots, perform correctness checking (identify deadlocks, data corruption, etc.), and simulate how your application would run on a different interconnect.
ITAC is an offline analysis tool - first you run your application to collect a trace file, then you can open the trace in a GUI analyzer to view it.
Installed Versions
For the current list of installed versions, use:
$ ml av itac
Collecting Traces
ITAC can collect traces from applications that are using Intel MPI. To generate a trace, simply add the -trace option to your mpirun command:
$ ml itac/2020.3.036
$ mpirun -trace myapp
The trace will be saved in the myapp.stf file in the current directory.
Viewing Traces
To view and analyze the trace, open the ITAC GUI in a graphical environment:
$ ml itac/2020.3.036
$ traceanalyzer
The GUI will launch and you can open the produced *.stf file.
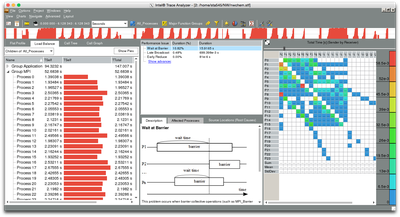
Refer to the Intel documenation about usage of the GUI tool.