TotalView
Introduction
TotalView is a GUI-based source code multi-process, multi-thread debugger.
Installed Versions
For the current list of installed versions, use:
$ ml av TotalView
License and Limitations for Cluster Users
On the cluster, users can debug OpenMP or MPI code that runs up to 64 parallel processes. This limitation means that 1 user can debug up 64 processes, or 32 users can debug 2 processes, etc.
Debugging of GPU accelerated codes is also supported.
You can check the status of the licenses for Karolina or Barbora:
$ cat /apps/user/licenses/totalview_features_state.txt

    # totalview
    # -------------------------------------------------
    # FEATURE                       TOTAL   USED AVAIL
    # -------------------------------------------------
    TotalView_Team                     64      0     64
    Replay                             64      0     64
    CUDA                               64      0     64
Compiling Code to Run With TotalView
Modules
Load all necessary modules to compile the code. For example:
$ ml intel/2020b
Load the TotalView module:
$ ml TotalView/2021.2.14
Compile the code:
$ mpicc -g -O0 -o test_debug test.c
$ mpif90 -g -O0 -o test_debug test.f
Compiler Flags
Before debugging, you need to compile your code with theses flags:
Note
-g Generates extra debugging information usable by GDB. -g3 includes additional debugging information. This option is available for GNU, Intel C/C++, and Fortran compilers.
-O0 Suppresses all optimizations.
Starting a Job With TotalView
Be sure to log in with an X window forwarding enabled. This could mean using the -X in the ssh:
local $ssh -X username@login1.karolina.it4i.cz
Another option is to access the login node using VNC.
From the login node an interactive session with X windows forwarding (--x11 option) can be started by the following command:
$ salloc -A PROJECT_ID -p qcpu --nodes=1 --ntasks-per-node=128 --cpus-per-task=1 --time=01:00:00 --x11
Then launch the debugger with the totalview command followed by the name of the executable to debug.
Debugging a Serial Code
To debug a serial code, use:
$ totalview test_debug
Debugging a Parallel Code - Option 1
To debug a parallel code compiled with OpenMPI, you need to setup your TotalView environment:
Hint
To be able to run a parallel debugging procedure from the command line without stopping the debugger in the mpiexec source code, you have to add the following function to your ~/.tvdrc file.
proc mpi_auto_run_starter {loaded_id} {
    set starter_programs {mpirun mpiexec orterun}
    set executable_name [TV::symbol get $loaded_id full_pathname]
    set file_component [file tail $executable_name]

    if {[lsearch -exact $starter_programs $file_component] != -1} {
        puts "*************************************"
        puts "Automatically starting $file_component"
        puts "*************************************"
        dgo
    }
}

# Append this function to TotalView's image load callbacks so that
# TotalView run this program automatically.

dlappend TV::image_load_callbacks mpi_auto_run_starter
The source code of this function can be also found in
$ $EBROOTOPENMPI/etc/openmpi-totalview.tcl
You can also add only following line to your ~/.tvdrc file instead of the entire function:
$ source $EBROOTOPENMPI/etc/openmpi-totalview.tcl
You need to do this step only once. See also OpenMPI FAQ entry.
Now you can run the parallel debugger using:
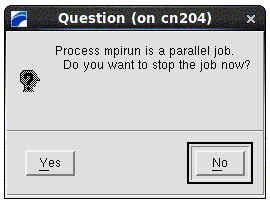
$ mpirun -tv -n 5 ./test_debug
When the following dialog appears, click on "Yes"
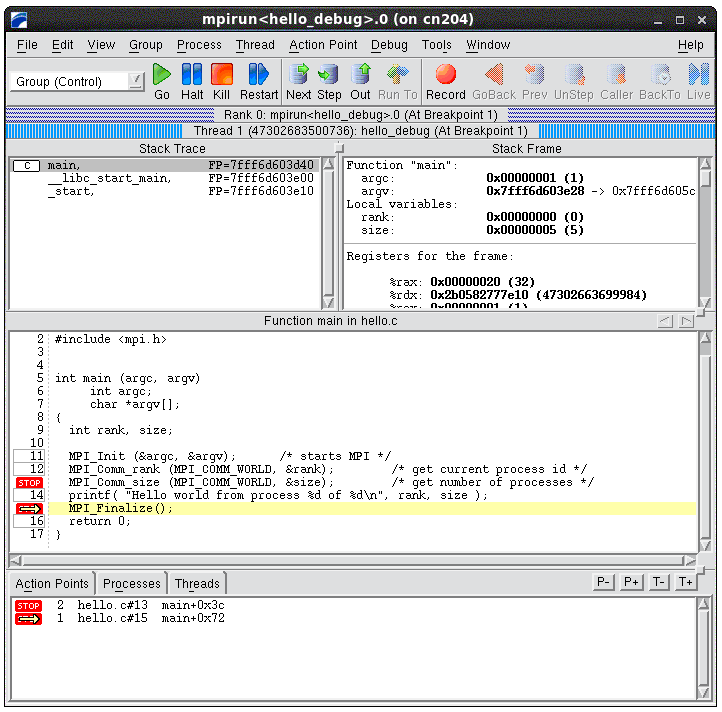
At this point, the main TotalView GUI window will appear and you can insert the breakpoints and start debugging:
Debugging a Parallel Code - Option 2
Another option to start a new parallel debugging session from a command line is to let TotalView to execute mpirun by itself. In this case, the user has to specify an MPI implementation used to compile the source code.
The following example shows how to start a debugging session with the Intel MPI:
$ ml intel/2020b TotalView/2021.2.14
$ totalview -mpi "Intel MPI-Hydra" -np 8 ./hello_debug_impi
After running the previous command, you will see the same window as shown in the screenshot above.
More information regarding the command line parameters of the TotalView can be foundin the TotalView Reference Guide, Chapter 7: TotalView Command Syntax.
Documentation
[1] The TotalView documentation web page is a good source for learning more about some of the advanced TotalView features.